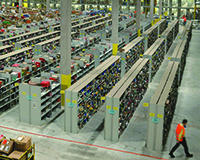
Sheds market ends year on a high
Megasheds now account for almost three times as much industrial space as they did five years ago.
Units of over 500,000 sq ft accounted for more than 8% of the total overall space shifted in 2016, according to EGi data. Their slice of the market has climbed consistently year-on-year from 3.55% in 2011.
The overall industrial market closed 2016 on a resurgent note, with Q4 recording the highest final-quarter level of take-up since 2014, topping out at just over 40m sq ft of space shifted. Other sectors may have suffered as uncertainty slowed transactions, but industrial proved resilient post-referendum, with Q4 2016 the highest recorded quarter since Q1 2015.
EGi recorded almost 143.5m sq ft transacted as a whole last year, just shy of the 145.5m sq ft recorded in 2015 but some way behind the strong 164m sq ft recorded in 2014.
Regionally, Yorkshire & Humberside saw more than 18m sq ft of space traded last year, a 35% rise on the 13.5m sq ft recorded in 2015. The South West saw a 20% increase to 10.75m sq ft. Notable fallers included Northern Ireland and the North West. And on average rent per sq ft, the biggest annual increase was recorded in the East Midlands at 8.9%. London, the North East, the South East and the South West all showed more than 7% annual growth in average rent per sq ft.
More than 11.75m sq ft of megasheds were transacted during 2016, more than double the previous year’s total and significantly up on 2014’s 9.5m. The biggest deal of the year was Amazon’s in Tilbury, Essex.
Average rent per sq ft
2011
2012
2013
2014
2015
2016
East Midlands
£4.50
£4.57
£4.64
£4.72
£4.93
£5.37
East of England
£5.05
£4.94
£4.90
£4.99
£5.49
£5.74
London
£8.54
£8.61
£9.14
£9.35
£10.39
£11.15
North East
£4.83
£4.63
£4.73
£4.77
£4.67
£5.02
North West
£4.78
£4.55
£4.63
£4.66
£4.86
£5.04
Northern Ireland
£4.03
£3.93
£3.93
£4.05
£4.16
£4.16
Scotland
£5.80
£5.98
£5.73
£5.61
£5.80
£5.70
South East
£6.32
£6.55
£6.61
£6.73
£7.34
£7.87
South West
£5.64
£5.83
£5.74
£5.66
£5.90
£6.35
Wales
£4.36
£4.57
£4.52
£4.85
£4.73
£4.68
West Midlands
£4.66
£4.80
£4.67
£4.77
£4.90
£5.13
Yorkshire & Humberside
£4.59
£4.66
£4.84
£4.72
£4.94
£5.07
Grand Total
£5.41
£5.49
£5.59
£5.57
£5.88
£6.07